If you’re interested in analyzing stock market data, one of the first challenges you’ll face is actually getting the data. Fortunately, the yfinance library makes this incredibly simple. In this tutorial, we’ll learn how to pull historical OHLCV data (Open, High, Low, Close, Volume) for any stock ticker using Python.
What is OHLCV Data?
Before we dive in, let’s quickly define what OHLCV means:
- Open: The price at which a stock started trading when the market opened
- High: The highest price the stock reached during the trading period
- Low: The lowest price the stock reached during the trading period
- Close: The price at which the stock ended when the market closed
- Volume: The number of shares traded during the period
This data is fundamental for technical analysis, backtesting trading strategies, or simply understanding historical price movements.
Setting Up Your Environment
First, you’ll need to install the yfinance library. Open your terminal or command prompt and run:
pip install yfinance
That’s it! You’re ready to start pulling data.
Basic Usage: Getting Stock Data
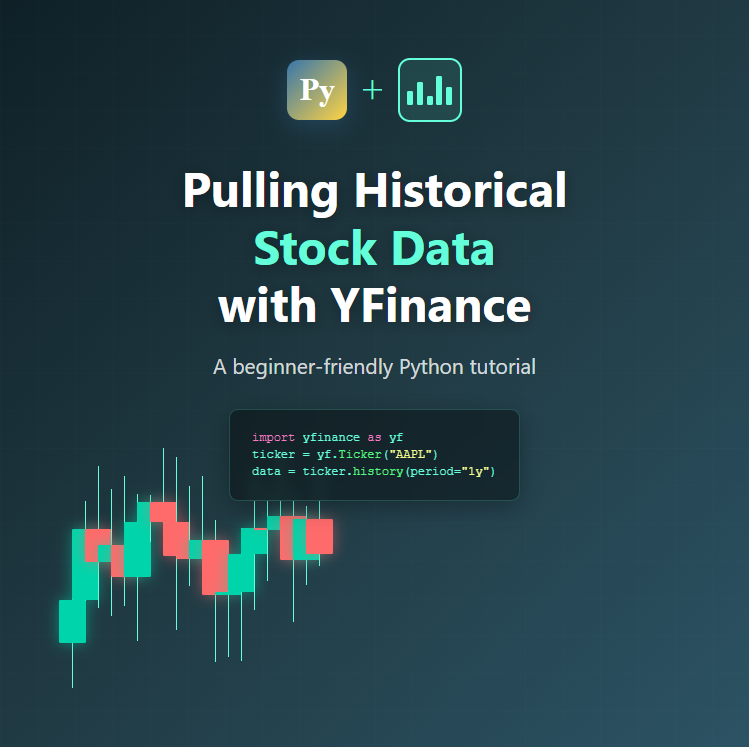
Let’s start with the simplest example. Here’s how to download historical data for Apple (AAPL):
import yfinance as yf

# Download data for Apple
ticker = yf.Ticker("AAPL")
data = ticker.history(period="1mo")

print(data)
This code downloads the last month of trading data for Apple. The output will be a pandas DataFrame with columns for Open, High, Low, Close, Volume, and a few other fields.
Customizing Your Data Request
The history() method is quite flexible. Here are some common ways to customize your request:
Specifying Time Periods
import yfinance as yf

ticker = yf.Ticker("MSFT")

# Get 1 year of data
data_1y = ticker.history(period="1y")

# Get 5 years of data
data_5y = ticker.history(period="5y")

# Get maximum available data
data_max = ticker.history(period="max")
Valid period options include: 1d, 5d, 1mo, 3mo, 6mo, 1y, 2y, 5y, 10y, ytd, max
Specifying Exact Date Ranges
If you need data for a specific date range, use the start and end parameters:
import yfinance as yf

ticker = yf.Ticker("GOOGL")

# Get data between specific dates
data = ticker.history(start="2023-01-01", end="2024-01-01")

print(data.head())
Adjusting Data Intervals
By default, yfinance returns daily data, but you can change the interval:
import yfinance as yf

ticker = yf.Ticker("TSLA")

# Get hourly data for the last 5 days
hourly_data = ticker.history(period="5d", interval="1h")

# Get weekly data for the last year
weekly_data = ticker.history(period="1y", interval="1wk")
Valid intervals include: 1m, 2m, 5m, 15m, 30m, 60m, 90m, 1h, 1d, 5d, 1wk, 1mo, 3mo
Working with Multiple Tickers
You can download data for multiple stocks at once using the download() function:
import yfinance as yf

# Download data for multiple tickers
tickers = ["AAPL", "MSFT", "GOOGL", "AMZN"]
data = yf.download(tickers, start="2023-01-01", end="2024-01-01")

print(data["Close"])  # Access closing prices for all tickers
A Practical Example: Simple Data Analysis
Let’s put it all together with a practical example that calculates the daily returns for a stock:
import yfinance as yf

# Download one year of Apple stock data
ticker = yf.Ticker("AAPL")
data = ticker.history(period="1y")

# Calculate daily returns
data["Daily_Return"] = data["Close"].pct_change()

# Display basic statistics
print(f"Average Daily Return: {data['Daily_Return'].mean():.4f}")
print(f"Standard Deviation: {data['Daily_Return'].std():.4f}")
print(f"\nFirst 5 rows:")
print(data[["Close", "Daily_Return"]].head())
Saving Your Data
Once you’ve downloaded the data, you might want to save it for later use:
import yfinance as yf

ticker = yf.Ticker("AAPL")
data = ticker.history(period="1y")

# Save to CSV
data.to_csv("apple_stock_data.csv")

# Later, you can load it back
import pandas as pd
loaded_data = pd.read_csv("apple_stock_data.csv", index_col=0, parse_dates=True)
Common Pitfalls and Tips
Ticker Symbols: Make sure you’re using the correct ticker symbol. For international stocks, you may need to add the exchange suffix (e.g., “AAPL” for NASDAQ, “0700.HK” for Hong Kong).
Market Hours: Intraday data (intervals less than 1 day) is only available for the last 60 days.
Missing Data: Markets are closed on weekends and holidays, so you’ll see gaps in the data for those dates.
Rate Limiting: If you’re downloading data for many tickers, consider adding delays between requests to avoid being rate-limited.
Next Steps
Now that you know how to pull historical stock data, you can:
- Build visualizations using matplotlib or plotly
- Calculate technical indicators like moving averages
- Backtest trading strategies
- Perform statistical analysis on price movements
The yfinance library is a powerful tool that opens up endless possibilities for financial data analysis. Happy coding!
Have questions or suggestions? Feel free to leave a comment below!